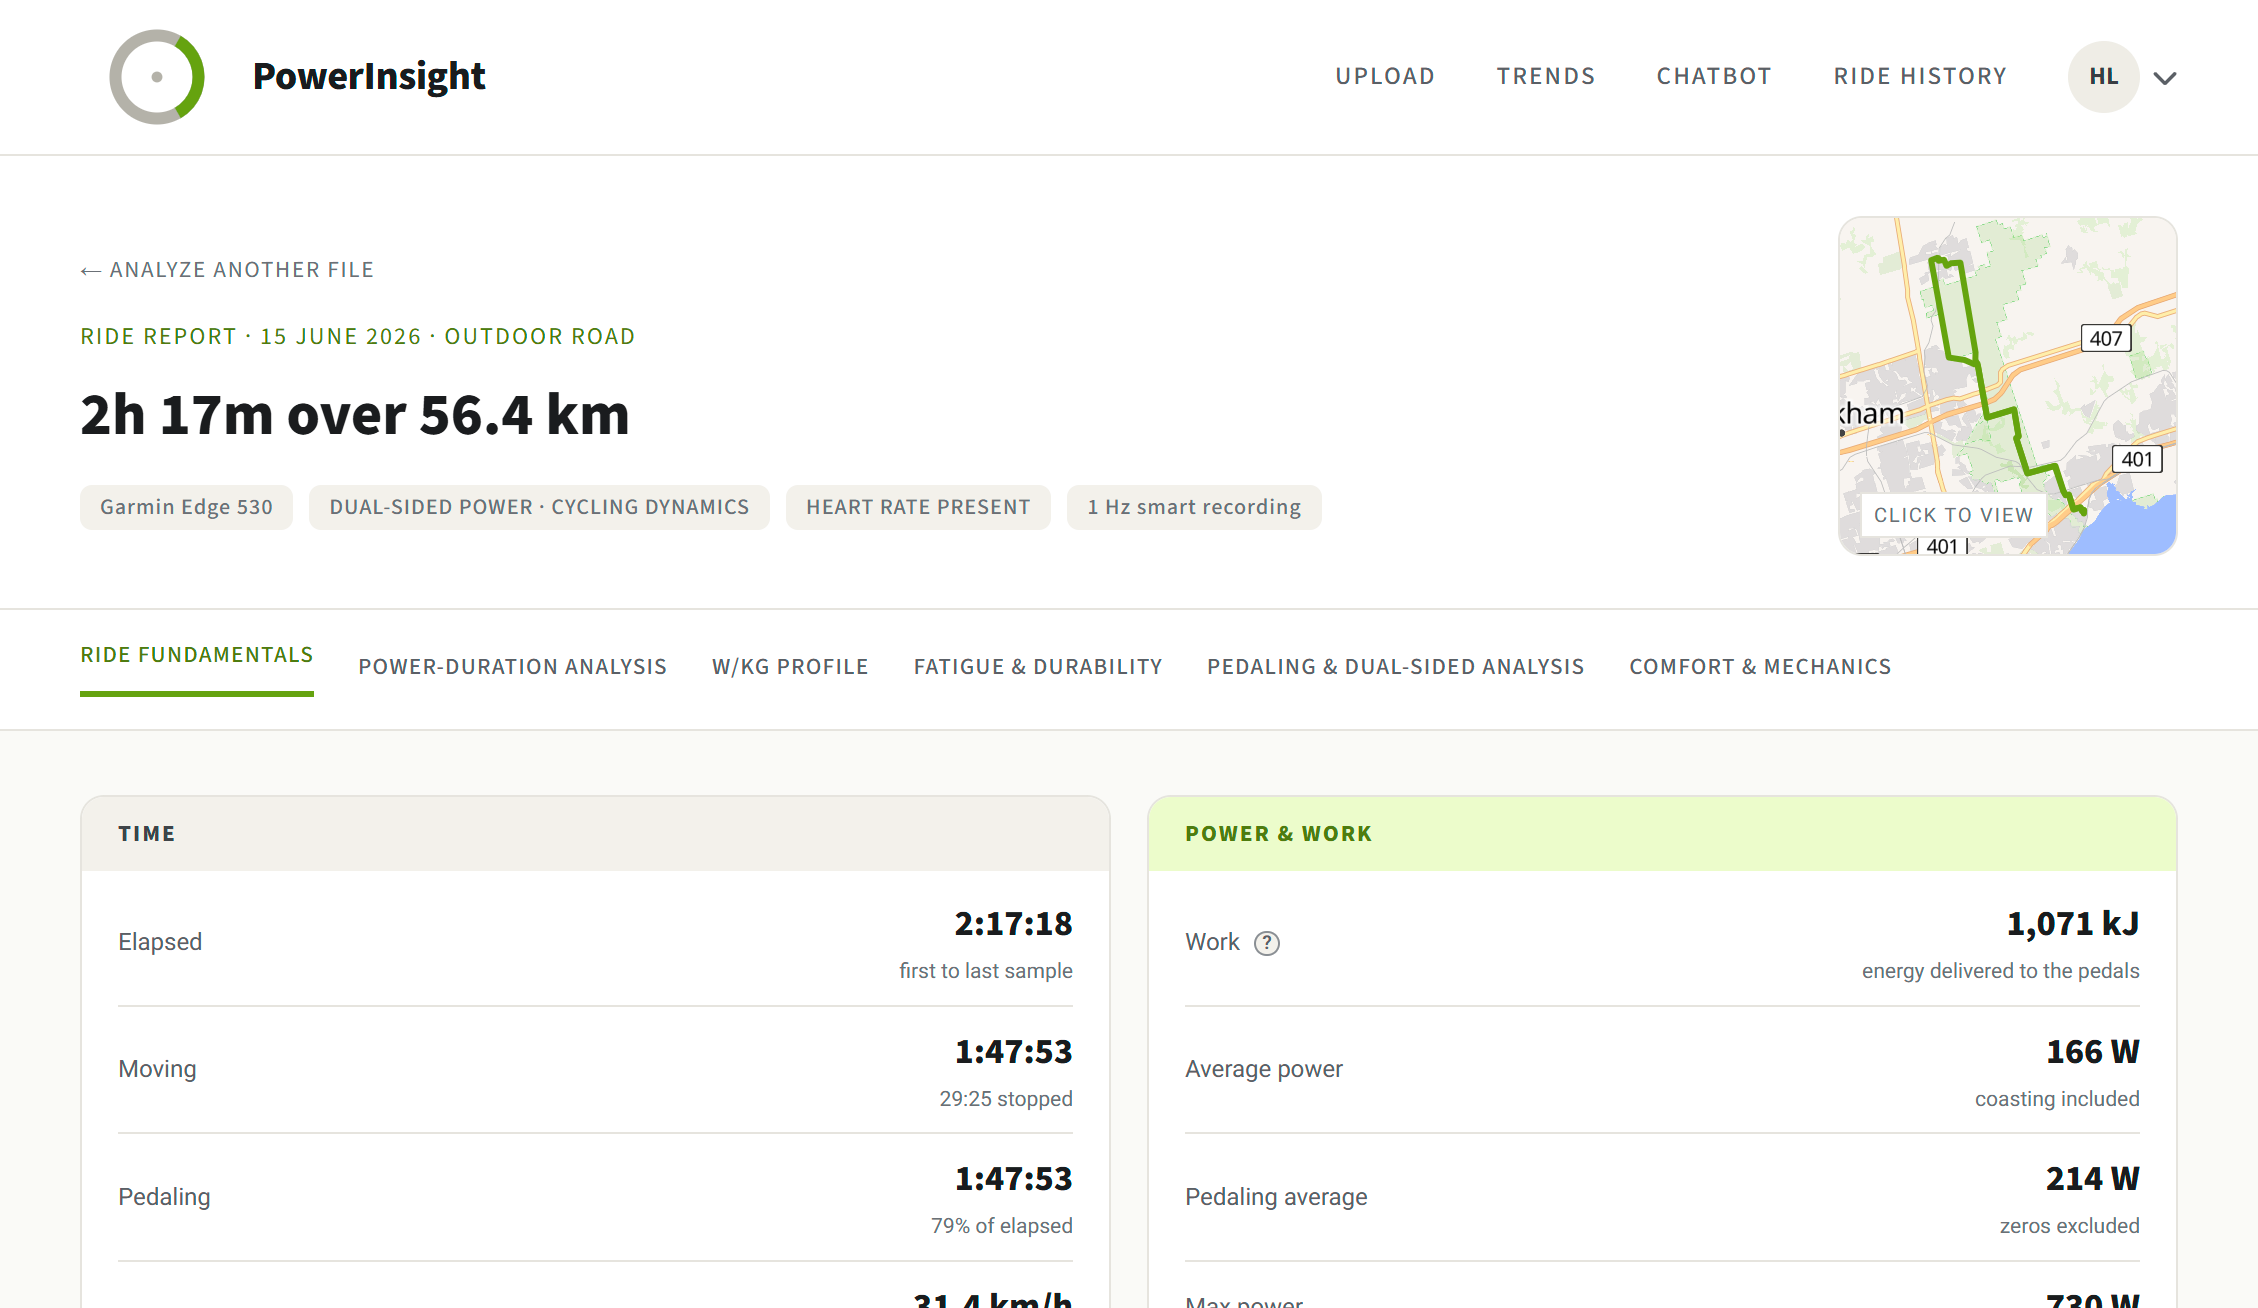
What the report contains
Duration, work, average and normalized power, intensity factor and TSS, time in each zone — and the strengths, weaknesses, opportunities and threats drawn from them, with one ranked thing to work on.
The best average power you held at every duration the file supports, plus a critical-power fit when the ride actually contains efforts long and hard enough to justify one.
The same durations in watts per kilo, once you give a weight. No ranking against other riders: the reference tables that would rank you are not solid enough to print.
Whether power faded from the first third of the ride to the last, how far heart rate drifted away from power, and how evenly the ride was paced.
Left/right balance overall and per zone, with torque effectiveness and pedal smoothness when your meter records them. A single-sided meter is told it cannot answer this, not halved.
Where your cadence actually sat and whether it drifted over the ride. Framed as something to raise with a bike fitter or physio — never as a diagnosis.
Choose more than one file at once and you get the longitudinal report instead — the cross-ride section, because a batch has no single route and no one ride to be about. Methodology explains how the numbers are reached.
How it works
Choose a ride file
A .fit or .tcx export from your head unit. Weight, FTP and the rest of the profile are optional — leave one out and the report names the numbers it cannot compute without it instead of estimating around the gap.
It is analyzed in this page
The analysis is Python, compiled to WebAssembly and run by your own browser. There is no processing request to send, which is what makes the promise above architectural rather than a policy.
Read it, download it, keep it
The report opens in six sections and downloads as a document. Each analyzed ride is saved to your account, so a history builds up — and past five rides, trends across them.
What it does not do
- No training plans, workout builder or calendar. It reads a ride; it does not tell you what to do next week.
- No medical or injury diagnosis, ever. An asymmetry or comfort finding is something to discuss with a bike fitter or physio.